|
Statistical
modelling/Milk offtake
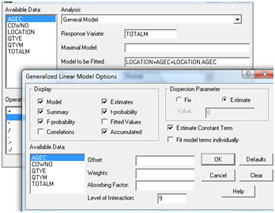
The next step is to investigate whether non-parallel lines
better represent the data. This is achieved by fitting an interaction term in
the model.Here we use the Options button to allow Accumulated
to be ticked (see below). This allows an
accumulated analysis of variance to be included in the output which shows the
sums of squares accounted for by each term as it is added to the model.
The
output shows that the interaction term is significant (P<0.01). The
percentage variance accounted for increases from 32.4% in the previous analysis
to 35.9% here.
|
|
Response variate: TOTALM
Fitted terms: Constant+LOCATION+AGEC+AGEC.LOCATION
*** Summary of analysis ***
|
|
d.f. |
s.s. |
m.s. |
v.r. |
|
Regression |
3 |
30.23 |
10.0766 |
31.39 |
|
Residual |
160 |
51.37 |
0.3210 |
|
|
Total |
163 |
81.60 |
0.5006 |
|
Percentage variance accounted for 35.9
*** Estimates of parameters ***
|
|
estimate |
s.e. |
t(160) |
Constant |
0.983 |
0.161 |
6.09 |
LOCATION 1 |
1.411 |
0.212 |
6.67 |
AGEC |
0.0073 |
0.0250 |
0.29 |
AGEC.LOCATION 1 |
-0.1036 |
0.0333 |
-3.11
|
Parameters for factors are differences compared
with the reference level:
Factor Reference level: LOCATION 2
*** Accumulated analysis of variance ***
Change |
d.f. |
s.s. |
m.s. |
v.r. |
+ LOCATION |
1 |
24.0448 |
24.0448 |
74.90 |
+ AGEC |
1 |
3.0777 |
3.0777 |
9.59 |
+ AGEC.LOCATION |
1 |
3.1073 |
3.1073 |
9.68 |
Residual |
160 |
51.3656 |
0.3210 |
|
Total |
163 |
81.5953 |
0.5006 |
|
|
|